Advertisement
Advertisement
DOGE and SHIB Remain Under Pressure Following the Powell Speech
By:
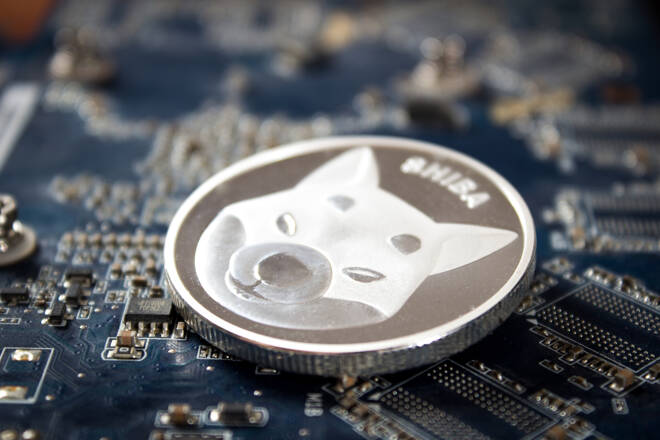
Following losses from last week, it is a choppy start to the week, with risk aversion pinning back a DOGE and SHIB breakout.
Key Insights:
- Dogecoin (DOGE) and Shiba Inu Coin (SHIB) joined the broader crypto market in the red on Sunday.
- Investor apprehension towards the week ahead left DOGE and SHIB in negative territory, with the crypto news wires providing little relief.
- Technical indicators are bearish, with EMAs pointing to further price declines.
On Sunday, Dogecoin (DOGE) fell by 2.72%. After having ended Saturday flat, DOGE ended the week down 10.85% to $0.061782. Following a 2.09% loss on Saturday, Shiba Inu Coin (SHIB) slid by 2.96% on Sunday to end the week down 5.38% to $0.00001181.
Range-bound through most of the Sunday session, DOGE and SHIB hit respective highs of $0.06431 and $0.00001246 before a final hour sell-off.
Weighed by the NASDAQ 100 Mini, DOGE slid to a low of $0.061298, with SHIB falling to $0.00001172 before finding support. Both DOGE and SHIB saw Major Support Levels tested in the late pullback.
However, crypto market conditions have improved this morning, with the NASDAQ 100 Mini reversing losses from early in the session. However, the NASDAQ 100 Mini remains in negative territory, which will test investor sentiment going into the US session.
At the time of writing, the NASDAQ 100 Mini was down 143 points.
There are no US economic indicators to provide direction later today. The lack of stats will leave the pair in the hands of FOMC member chatter and market risk sentiment.
Shiba Inu Coin (SHIB) Price Action
At the time of writing, SHIB was up 1.52% to $0.00001199.
A mixed morning saw SHIB fall to an early low of $0.00001169 before rising to a high of $0.00001213.
Technical Indicators
SHIB needs to break out from the $0.0000120 pivot to target the First Major Resistance Level (R1) at $0.0000123 and the Sunday high of $0.00001246.
SHIB would need a material shift in risk appetite to support a breakout from the morning high of $0.00001213.
In the case of a broad-based crypto rally, SHIB should test the Second Major Resistance Level (R2) at $0.0000127 and resistance at $0.0000130. The Third Major Resistance Level (R3) sits at $0.0000135.
Failure to break out from the pivot would leave the First Major Support Level (S1) at $0.0000115 in play. Barring another extended sell-off throughout the day, SHIB should avoid sub-$0.0000110. The Second Major Support Level (S2) at $0.0000113 should limit the downside.
The Third Major Support Level (S3) sits at $0.0000105.
The EMAs send a bearish signal, with SHIB sitting below the 200-day EMA, currently at $0.00001283. This morning, the 50-day EMA closed in on the 200-day EMA, with the 100-day EMA narrowing to the 200-day EMA, both bearish signals.
A SHIB move through R1 ($0.0000123) and R2 ($0.0000127) would bring the 200-day EMA into view. However, a bearish cross of the 50-day EMA through the 200-day EMA would bring the Major Support Levels into play.
Dogecoin (DOGE) Price Action
At the time of writing, DOGE was up 0.02% to $0.06179. Tracking the broader market, DOGE fell to an early low of $0.06087 before rising to a high of $0.06214.
Technical Indicators
DOGE needs to move through the $0.0625 pivot to target the First Major Resistance Level (R1) at $0.0636 and the Sunday high of $0.06431.
Improved sentiment across the Crypto market would support a return to $0.0630.
In an extended crypto rally, DOGE should test the Second Major Resistance Level (R2) at $0.0655. The Third Major Resistance Level (R3) sits at $0.0685.
Failure to move through the pivot would leave the First Major Support Level (S1) at $0.0606 in play. Barring an extended sell-off, support at $0.0600 and the Second Major Support Level (S2) at $0.0595 should limit the downside.
The Third Major Support Level (S3) sits at $0.0564.
The EMAs sent a bearish signal, with DOGE below the 50-day EMA, currently at $0.06677. Following last week’s bearish crosses, the 50-day EMA slid back from the 100-day EMA, with the 100-day EMA pulling back from the 200-day EMA, both bearish signals.
DOGE will need to move through R1 ($0.0636) and R2 ($0.0655) to bring the 50-day EMA ($0.06677) into play.
However, a pullback from the 50-day EMA would leave the Major Support Levels in view.
About the Author
Bob Masonauthor
With over 28 years of experience in the financial industry, Bob has worked with various global rating agencies and multinational banks. Currently he is covering currencies, commodities, alternative asset classes and global equities, focusing mostly on European and Asian markets.
Advertisement
