
Advertisement
Advertisement
E-mini NASDAQ-100 Index (NQ) Futures Technical Analysis – Tech Stocks Climb Ahead of Long US Holiday Weekend
By:
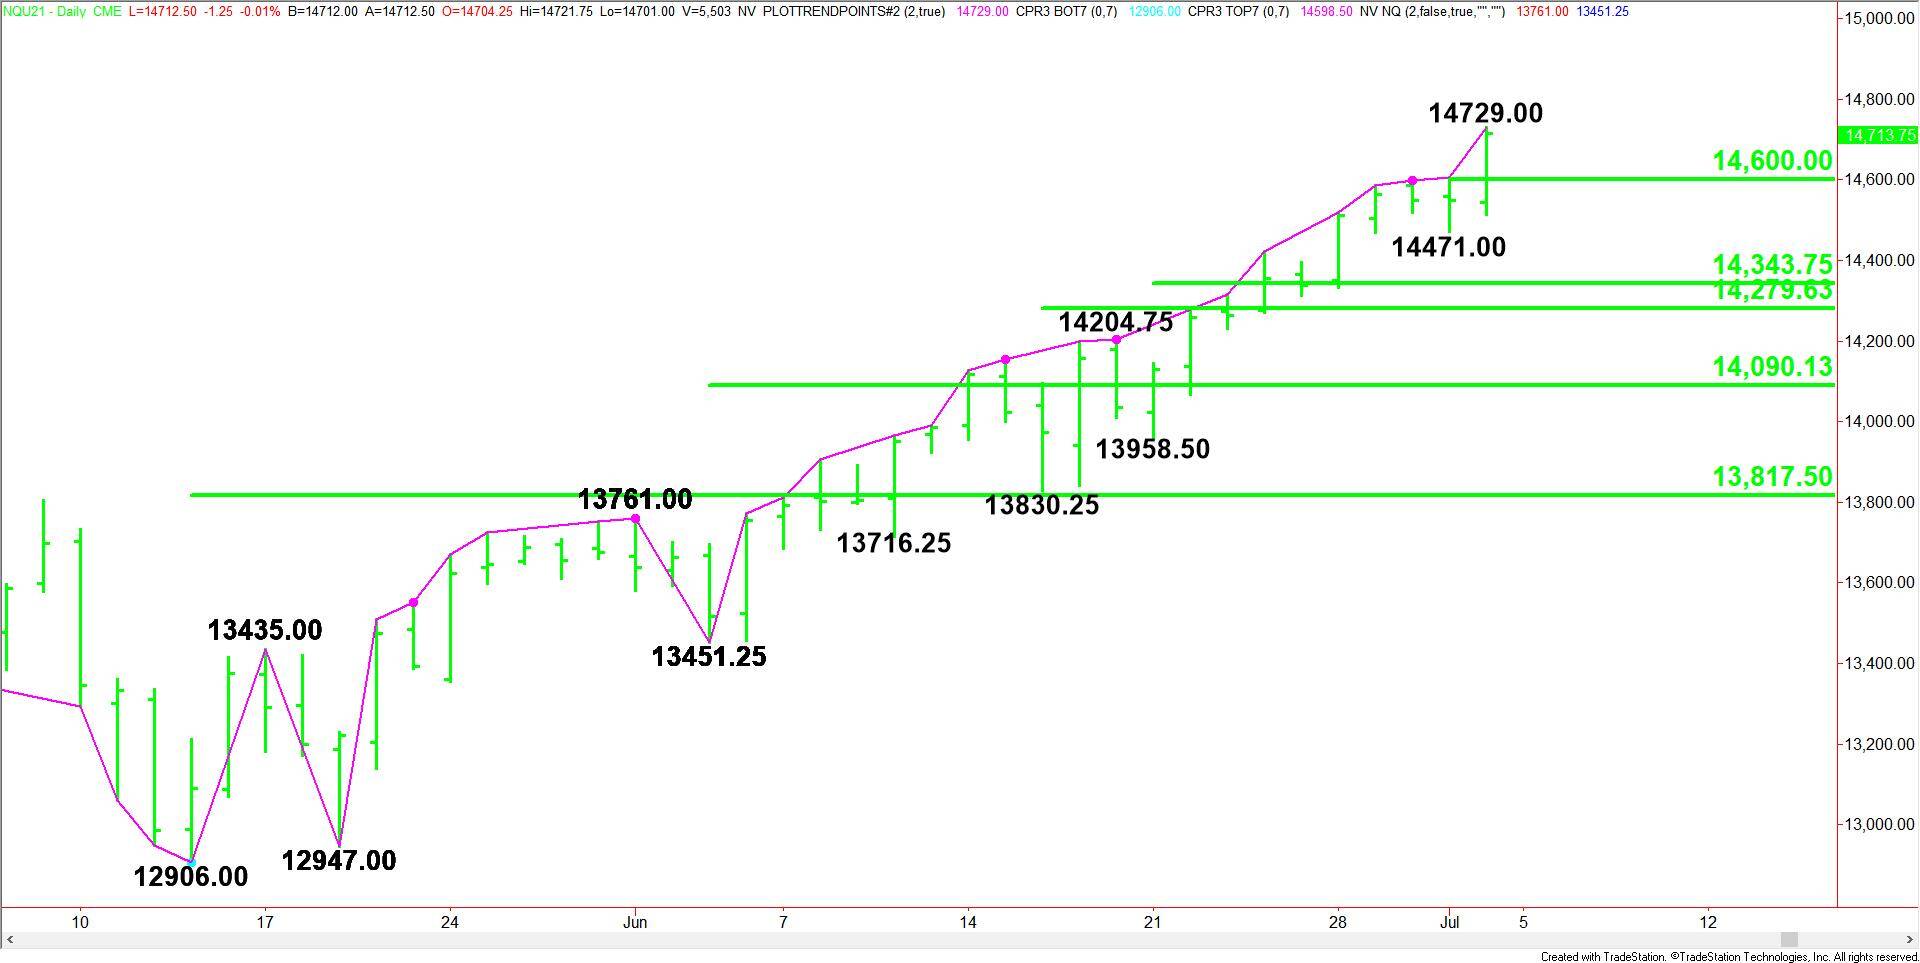
When the cash market reopens on Tuesday, a trade through 14729.00 will signal a resumption of the uptrend.

September E-mini NASDAQ-100 Index futures hit another record high on Friday after jobs data for June showed robust hiring yet persistent weakness in the labor market will keep the Federal Reserve from raising interest rates any time soon.
On Friday, September E-mini NASDAQ-100 Index futures settled at 14713.75, up 165.25 or +1.12%.
The Labor Department’s employment report showed non-farm payrolls increased by 850,000 jobs last month, but the total is 6.8 million below its peak in February 2020.
The better-than-expected data was a tentative sign that a labor shortage overhanging the U.S. economy was starting to ease but was not enough to force the Fed to raise rates.
Big tech led stocks on Wall Street higher while the yield on the benchmark 10-year U.S. Treasury note slid to 1.431%.
The rally was led by Microsoft Corp, followed by Apple Inc, Amazon.com Inc and Google-parent Alphabet Inc.
Trading was light heading into the long weekend, with U.S. markets shut on Monday in observance of U.S. Independence Day.
Daily Swing Chart Technical Analysis
The main trend is up according to the daily swing chart. A trade through 13451.25 will change the main trend to down. This is highly unlikely, but due to the prolonged move up in terms of price and time, the index remain vulnerable to a potentially bearish closing price reversal top.
The minor trend is also up. A trade through 14471.00 will change the minor trend to down. This will also shift momentum to the downside.
The minor range is 14471.00 to 14729.00. Its 50% level at 14600.00 is the nearest support.
If the minor trend changes to down then look for the selling to possibly extend into the next two pivots at 14343.75 and 14729.50. The latter is a potential trigger point for an acceleration into 14090.00.
Short-Term Outlook
When the cash market reopens on Tuesday, a trade through 14729.00 will signal a resumption of the uptrend. There is no target at this time since we’re at all-time highs.
Although there were three limited breaks following closing price reversal tops in June, this potentially bearish chart pattern should remain the key concern for bullish traders.
To some the reversal top will serve as a signal to trim long positions and wait for a pullback into a value area. Some aggressive counter-trend traders, however, may decide to take a riskier course of action by playing the short side.
For a look at all of today’s economic events, check out our economic calendar.
About the Author
James Hyerczykauthor
James Hyerczyk is a U.S. based seasoned technical analyst and educator with over 40 years of experience in market analysis and trading, specializing in chart patterns and price movement. He is the author of two books on technical analysis and has a background in both futures and stock markets.
Did you find this article useful?
Latest news and analysis


Advertisement