Nasdaq 100 Bounce Finds Buyers, but AI Credit Remains the Trade
Nasdaq futures are higher after last week’s AI selloff, but the first bounce has not changed the issue that knocked the group lower. CoreWeave lost 25% last week. Its credit default swaps reached distress levels. Goldman Sachs traders are looking at the widest AI credit spreads of the year.
Nasdaq-100 futures are up 1.32% early Monday. S&P 500 futures are up 0.2%. Oil is slightly lower after the weekend tanker and Russian energy headlines failed to extend Friday’s crude rally.
Last week’s break was not limited to one company. The Nasdaq fell 4.5%, ending a four-week winning streak. The S&P 500 lost nearly 2%, its largest weekly decline since late June. Friday brought in enough selling to force a response. Monday is that response.

Daily December E-mini Nasdaq-100 Index Futures Technical Analysis
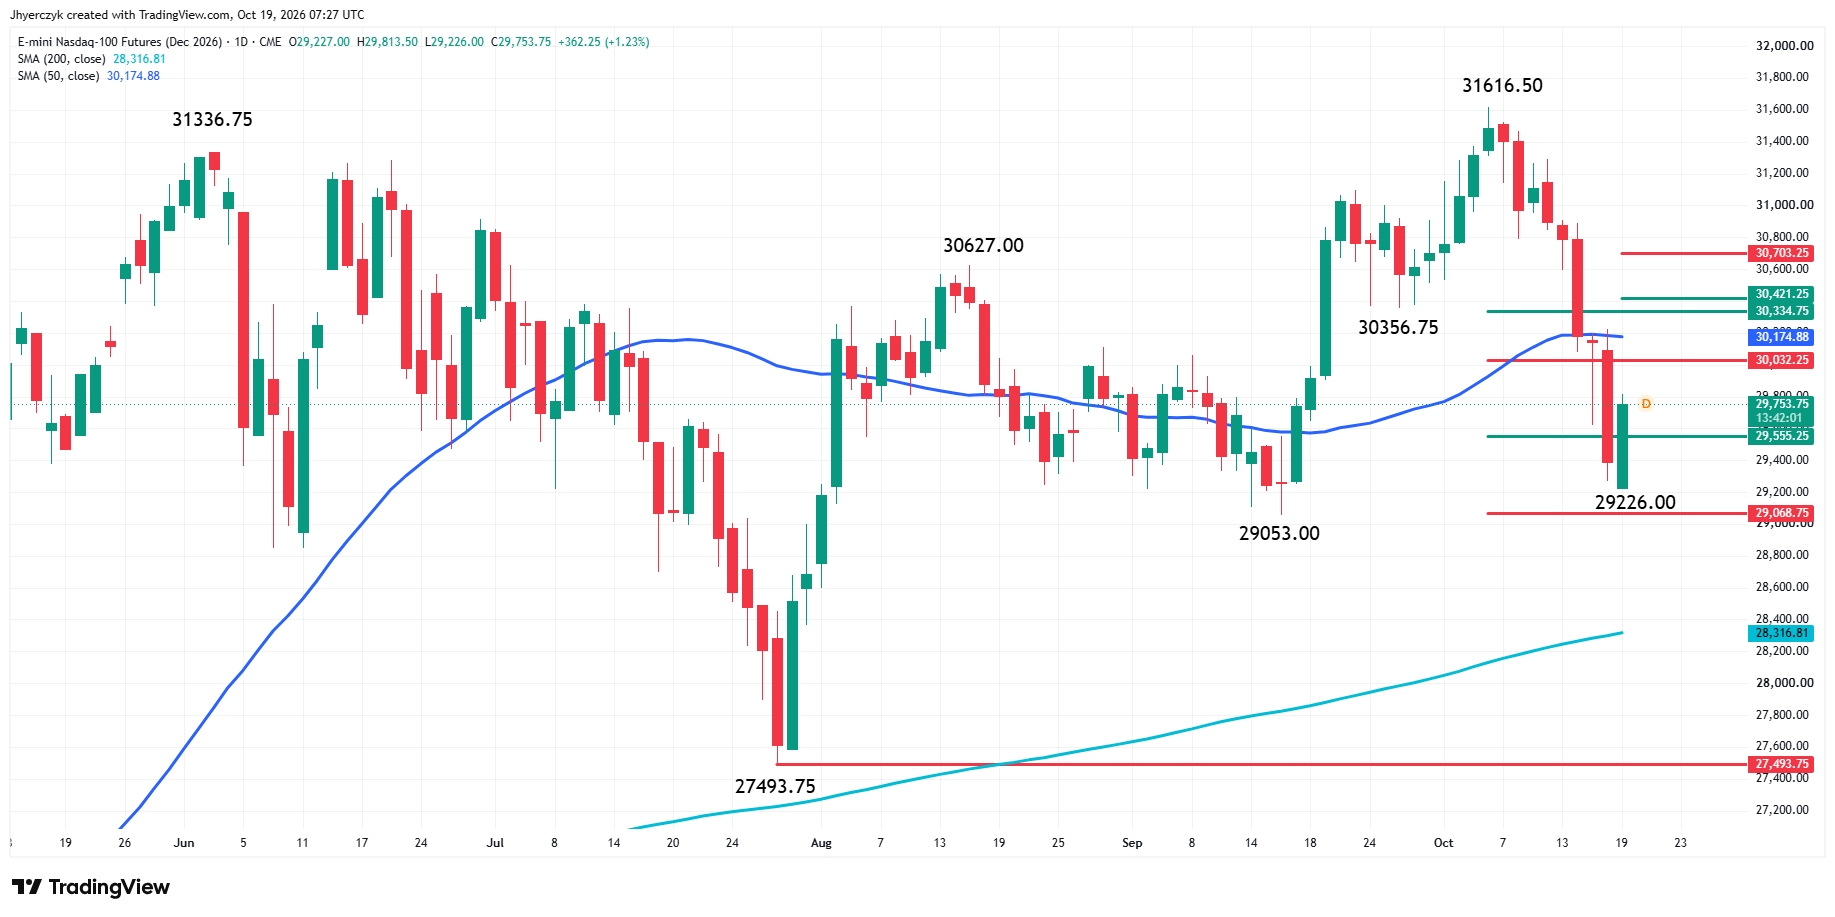
December E-mini Nasdaq-100 Index futures are sharply higher early Monday. The main trend is down according to the daily swing chart. A trade through the swing bottom at 29053.00 will reaffirm the downtrend. The main trend will change to up on a move through the record high at 31616.50.
The long-term range is 27493.75 to 31616.50. Its retracement zone at 29555.25 to 29068.75 was successfully tested early in the session at 29226.
The intermediate range is 29053.00 to 31616.50. Its retracement zone at 30032.25 to 30334.75 is the first target zone.
The short-term range is 31616.50 to 29226.00. Its retracement zone at 30421.25 to 30703.25 is the key target area.
The 50-day moving average at 30175.22 is controlling the momentum. Since the index is currently trading on the weak side of this indicator, it is also potential resistance.
NASDAQ 100 Price Forecast
Every new NASDAQ 100 analysis as it publishes, today's technical signal and key levels, live price — on one page.
See all NASDAQ 100 forecastsDaily December E-mini S&P 500 Index Futures Technical Analysis
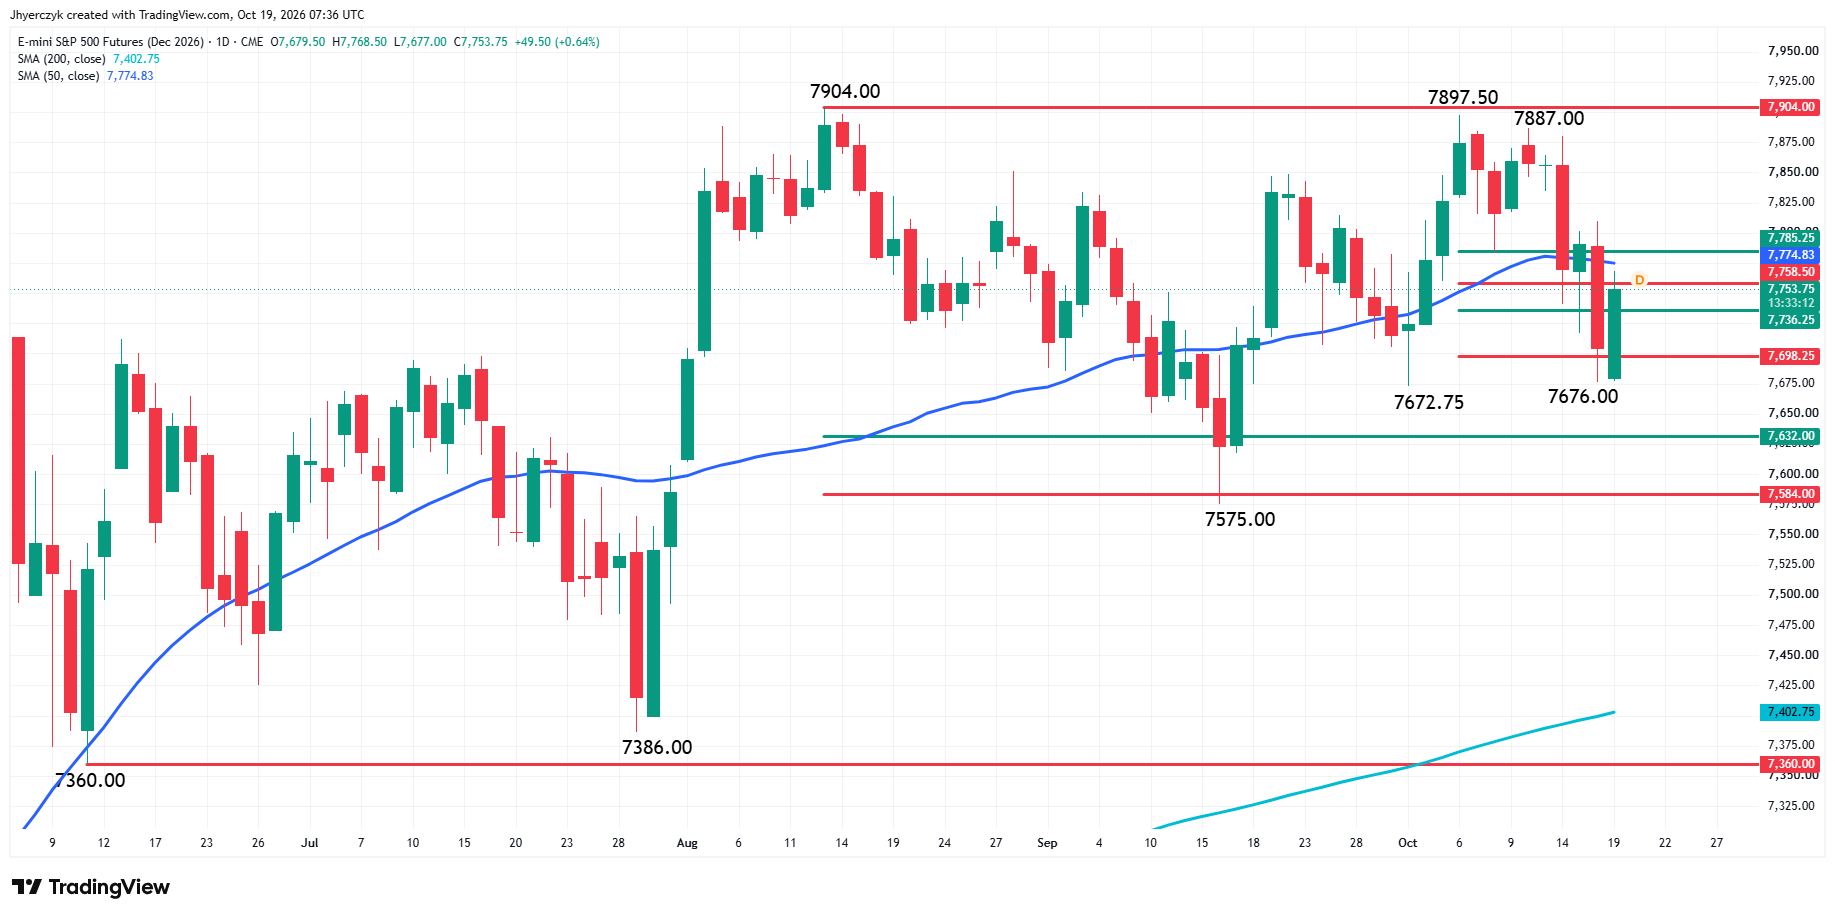
December E-mini S&P 500 Index futures are higher in the premarket trade on Monday. The rally started early after the index failed to take out Friday’s low at 7676.00.
The main trend is down according to the daily swing chart. A trade through 7887.00 will change the main trend to up. A move through 7672.75 will reaffirm the downtrend.
The long-term range is 7360.00 to 7904.00. Its retracement zone at 7632.00 to 7584.00 is a major downside target and potential value zone.
The intermediate range is 7575.00 to 7897.50. Its retracement zone is 7736.25 to 7698.25. Earlier today, the index penetrated the lower level of this range, stopping at 7677.00 before turning higher and recapturing the upper level of the zone at 7736.25.
The short-term range is 7672.75 to 7897.50. The index is currently testing its retracement zone at 7758.50 to 7785.25. Inside this area is the 50-day moving average at 7774.90.
CoreWeave Put the Debt Trade in Front of AI Stocks
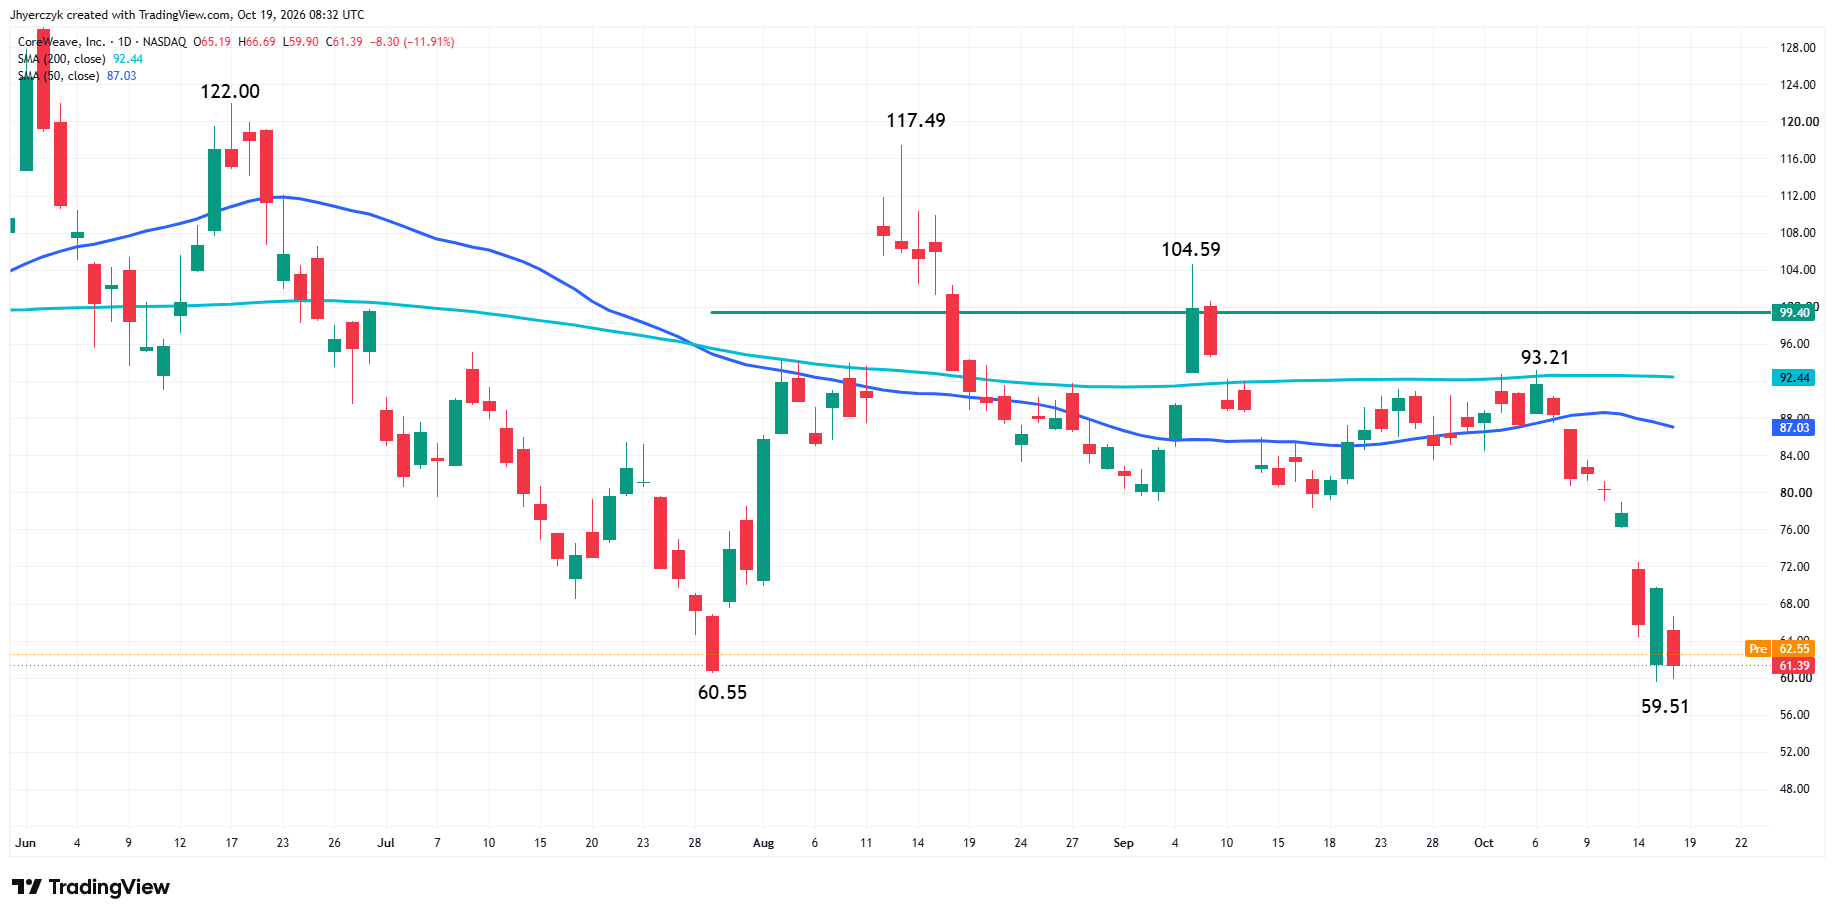
CoreWeave lost 25% last week, its largest weekly decline since November 2025. Its credit default swaps reached distress levels. That put the debt trade in front of the AI stocks.
Goldman Sachs traders said AI credit spreads, particularly among hyperscalers, are at their widest levels of the year. The last time they were this wide, the underlying equities were 15% lower.
Monday brought dip buyers back. The credit market is still leaning the other way.
Anthropic’s Revenue Number Did Not End the Argument
Anthropic reported third-quarter revenue of $16.8 billion, up from $11.6 billion in the second quarter. The revenue number was bigger. The argument over growth after the AI build-out did not go away.
Meta Platforms and Tesla report this week. Traders bought puts Friday at one of the highest rates of the year.
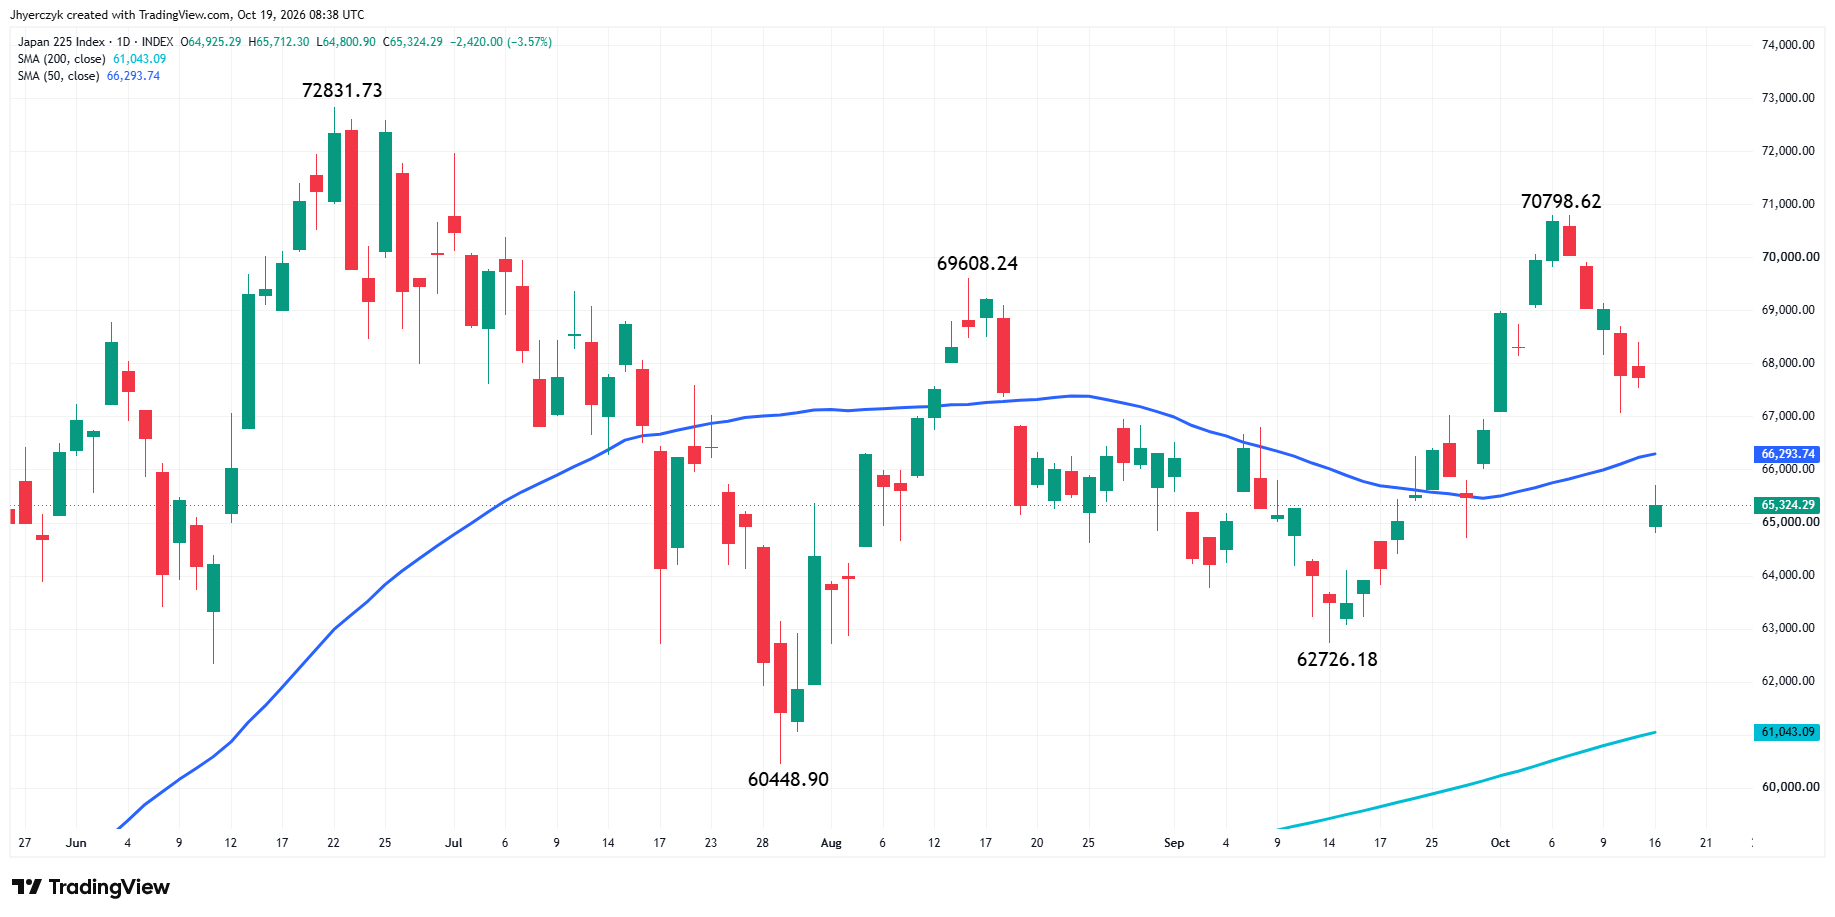
Asia did not give the U.S. rally much help. Japan’s Nikkei 225 fell 1.65%, South Korea’s Kospi lost 1.29% and China’s CSI 300 slipped 0.28%. Australia’s S&P/ASX 200 rose 0.37%.
Oil Is Not Giving Stocks a New Reason to Run
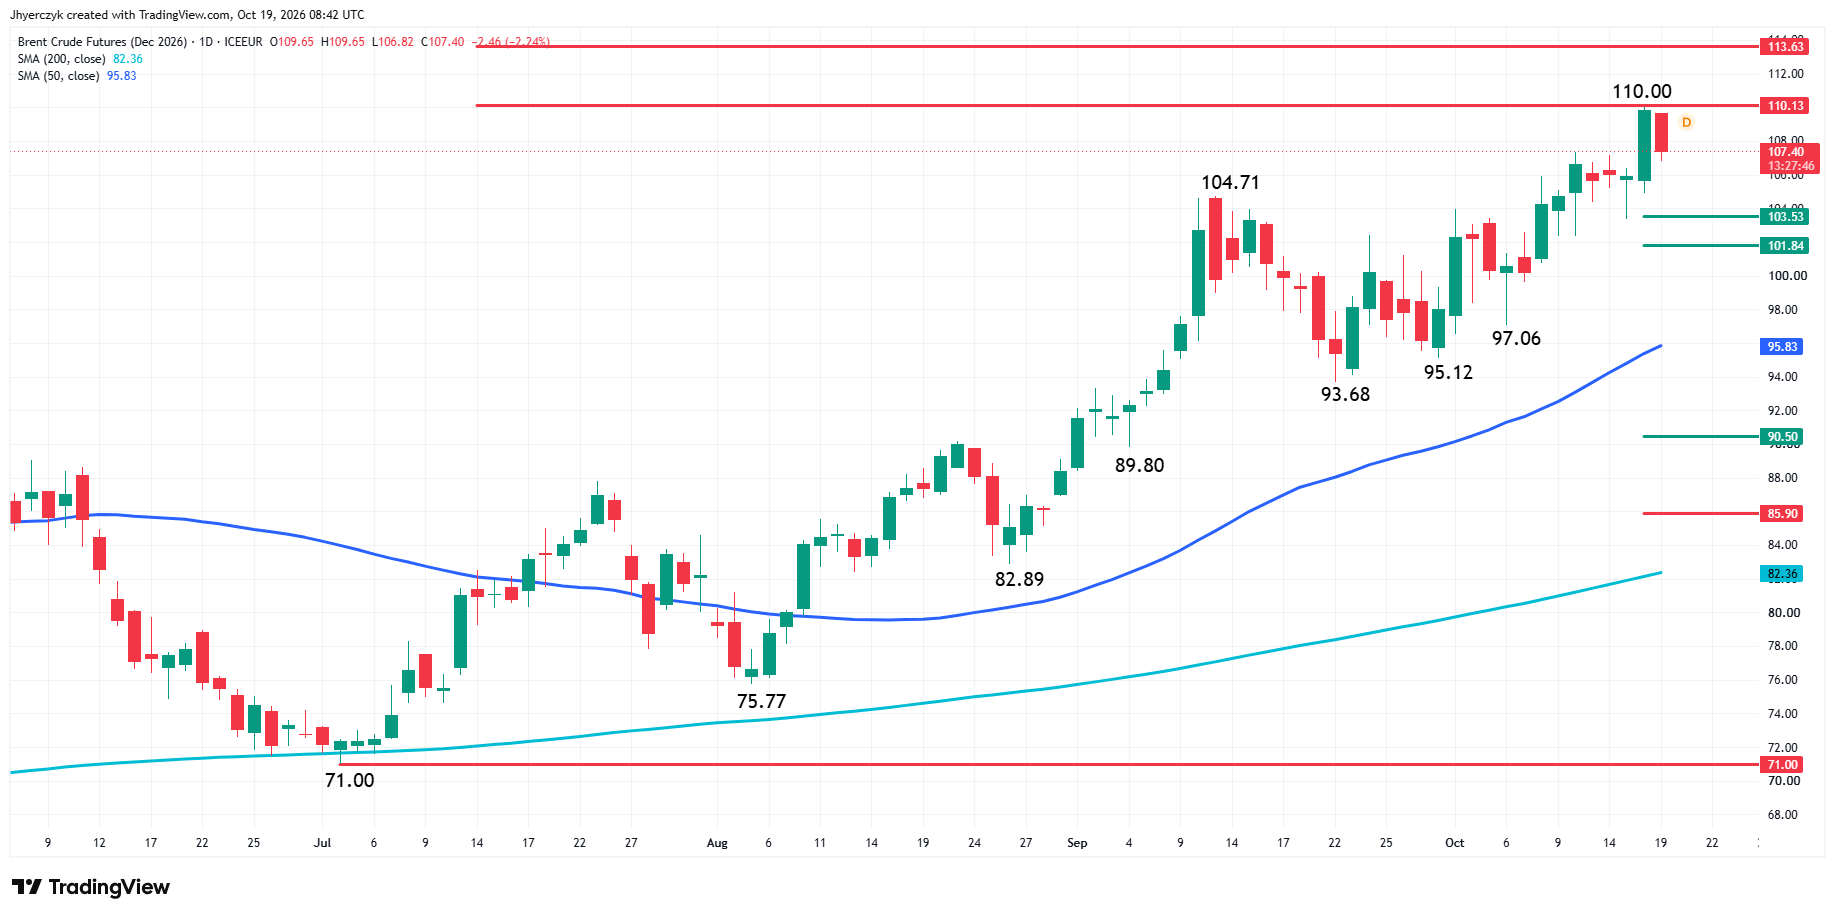
Brent and WTI are slightly lower despite further tanker attacks near Saudi Arabia and Yemen, along with Ukraine’s strike on a Russian oil terminal in St. Petersburg.
Longer-dated oil futures have moved higher on concern that energy disruptions could last into 2027. The front of the crude market backed off after Friday’s run.
What to Watch
Meta and Tesla report this week. AI credit spreads are already wide. The first bounce is running into both.
For December E-mini Nasdaq-100 Index futures, our bias is to the downside with the main trend down and the index on the weak side of the 50-day moving average.
We recognize the buying after the successful test of the retracement zone at 29555.25 to 29068.75. Counter-trend momentum could carry the index into 30032.25 to 30334.75, then 30421.25 to 30703.25.
Sellers could reemerge in these areas in an attempt to form a secondary lower top. If successful, the downtrend is likely to resume.
For December E-mini S&P 500 Index futures, my bias is to the downside because of the downtrend on the swing chart and the trade on the weak side of the 50-day moving average.
Trader reaction to the short-term retracement zone at 7758.50 to 7785.25 could alter my outlook. A strong momentum shift could take place on a sustained move over 7785.25, shifting my bias to the upside with potential targets at 7887.00 and 7897.50.
A sustained move under 7758.50 will suggest that sellers have returned, keeping my bearish outlook intact.
More Information in our Economic Calendar.