



Highlights
- Major U.S. stock indices like the Dow Jones and S&P 500 take a bearish turn post Non-Farm Payrolls report.
- The U.S. economy defies expectations, adding 336,000 jobs in September, dwarfing Dow Jones’ forecast.
- Despite robust job growth, wages lag behind, stoking fears of inflation on Wall Street.
Market Reacts to Surprisingly Strong Jobs Report
Friday’s opening bell signaled a bearish turn for major U.S. stock indices, following a robust Non-Farm Payrolls report that far exceeded expectations. Shortly after the cash market opening, the Dow Jones Industrial Average dropped 106.38 points or 0.32%, with the S&P 500 and the Nasdaq Composite following suit, down 0.46% each.

Job Growth and Treasury Yields
The U.S. economy added a staggering 336,000 jobs in September, outpacing Dow Jones’ forecast of 170,000. Despite this optimistic outlook on the labor market, wages increased less than anticipated, fueling concerns about inflation. Treasury yields spiked, with the benchmark 10-year yield touching near a 16-year high, sitting last at 4.873%.
Investor Sentiment and the Federal Reserve
Investors reacted with caution to the jobs data, raising concerns that the Federal Reserve will sustain elevated rates to combat inflation. The strong job numbers indicate that the Fed could further raise rates by 25 basis points, posing a continuous upside risk for interest rates and a downward pressure on stocks.
Tech Shares and Sectors Sensitive to Rates
Several big-cap tech stocks like Advanced Micro Devices, Nvidia, and Meta Platforms experienced more than a 1% decline. The utilities sector, traditionally sensitive to high rates, also saw significant losses, with AES falling 3.5% and other key players like NextEra Energy and Dominion Energy shedding over 1%.
Short-Term Forecast
In the short term, the market sentiment appears cautious, leaning bearish. The rise in Treasury yields suggests investors are preparing for a tighter monetary policy from the Fed, which could continue to place downward pressure on equities, particularly those sensitive to interest rates.
Technical Analysis
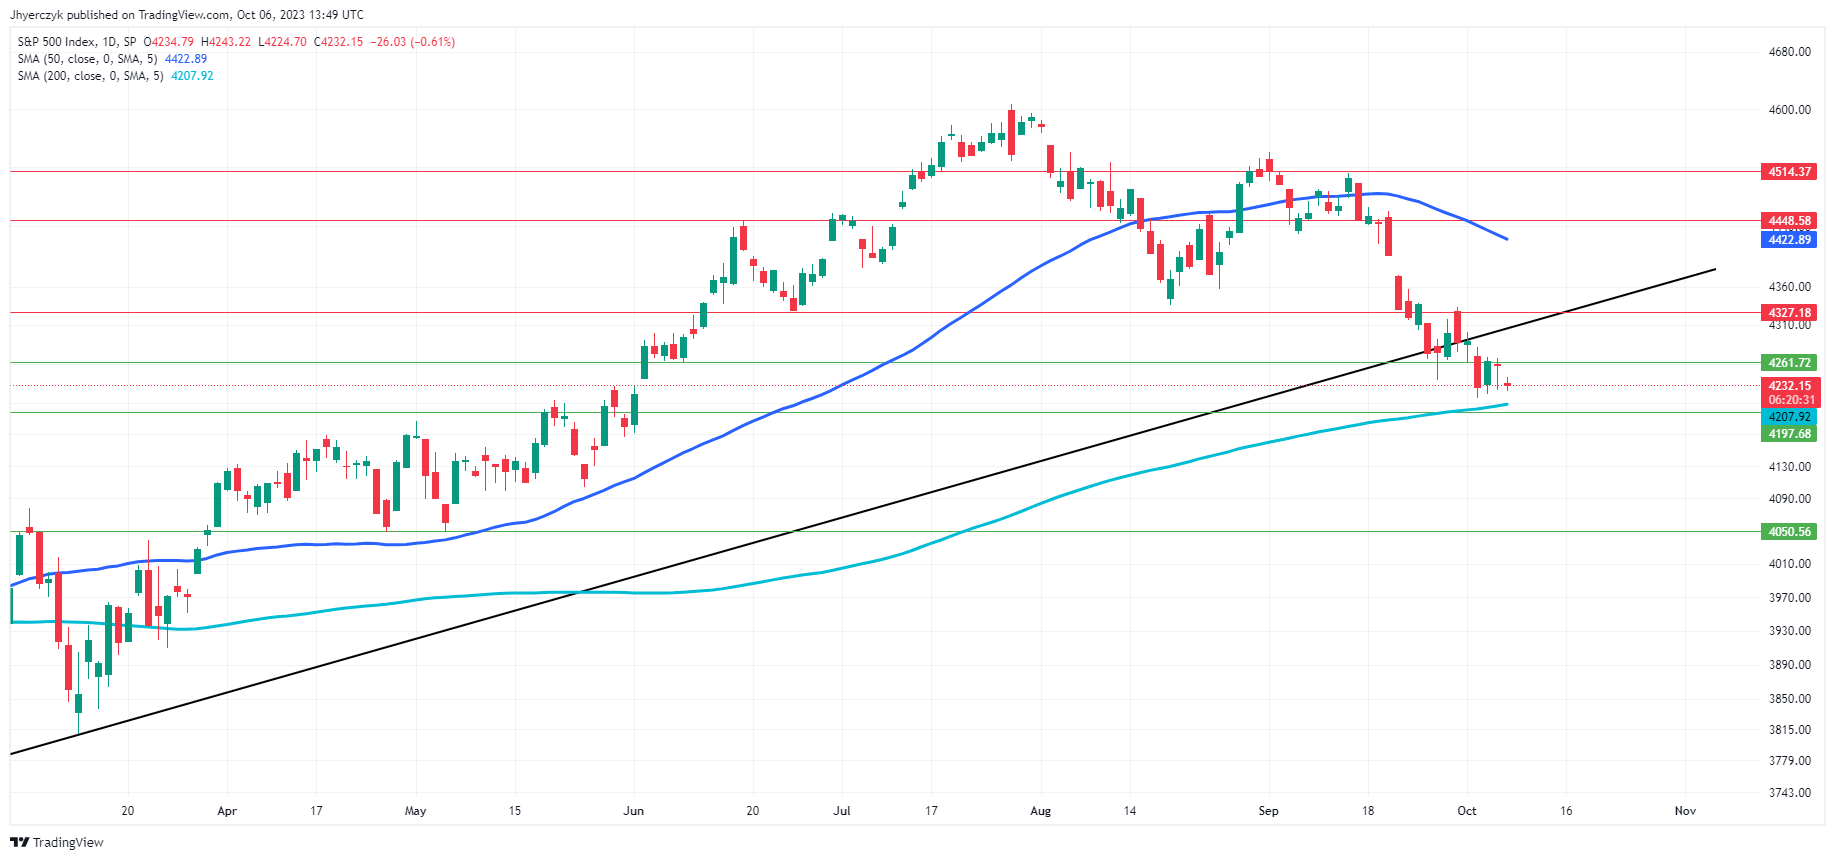
The S&P 500 Index currently sits at 4230.25, hovering just above its 200-Day moving average of 4207.90, indicating modest upward momentum. However, it falls short of its 50-Day moving average at 4422.80, signifying a possible trend reversal if the index doesn’t regain higher levels.
It resides between its minor support level at 4261.72 and main support level at 4197.68, which act as cushions against bearish moves. The index has breached its trend line support at 4303.30, which could catalyze a decline unless reversed.
Given the close proximity to the 200-Day average and the breach of trend line support, market sentiment appears cautiously bearish.


