
Target Zones From Last Month Reached
Most major US stock markets, like the NASDAQ100 (NDX), have set record highs after record highs recently. We all know nothing goes up forever, but when do the Bears get their chance other than being allowed to play in the sandbox during a brief recess? We primarily use the Elliott Wave Principle (EWP) to answer that question. Allow us to explain using Figure 1 below .
NASDAQ 100 Price Forecast
Every new NASDAQ 100 analysis as it publishes, today's technical signal and key levels, live price — on one page.
See all NASDAQ 100 forecastsThe NDX has been following an impulse higher since its mid-April low, invalidating the counter-trend rally possibility we were tracking last month, where we were looking for at least $18815-19036 as a (green) W-c.
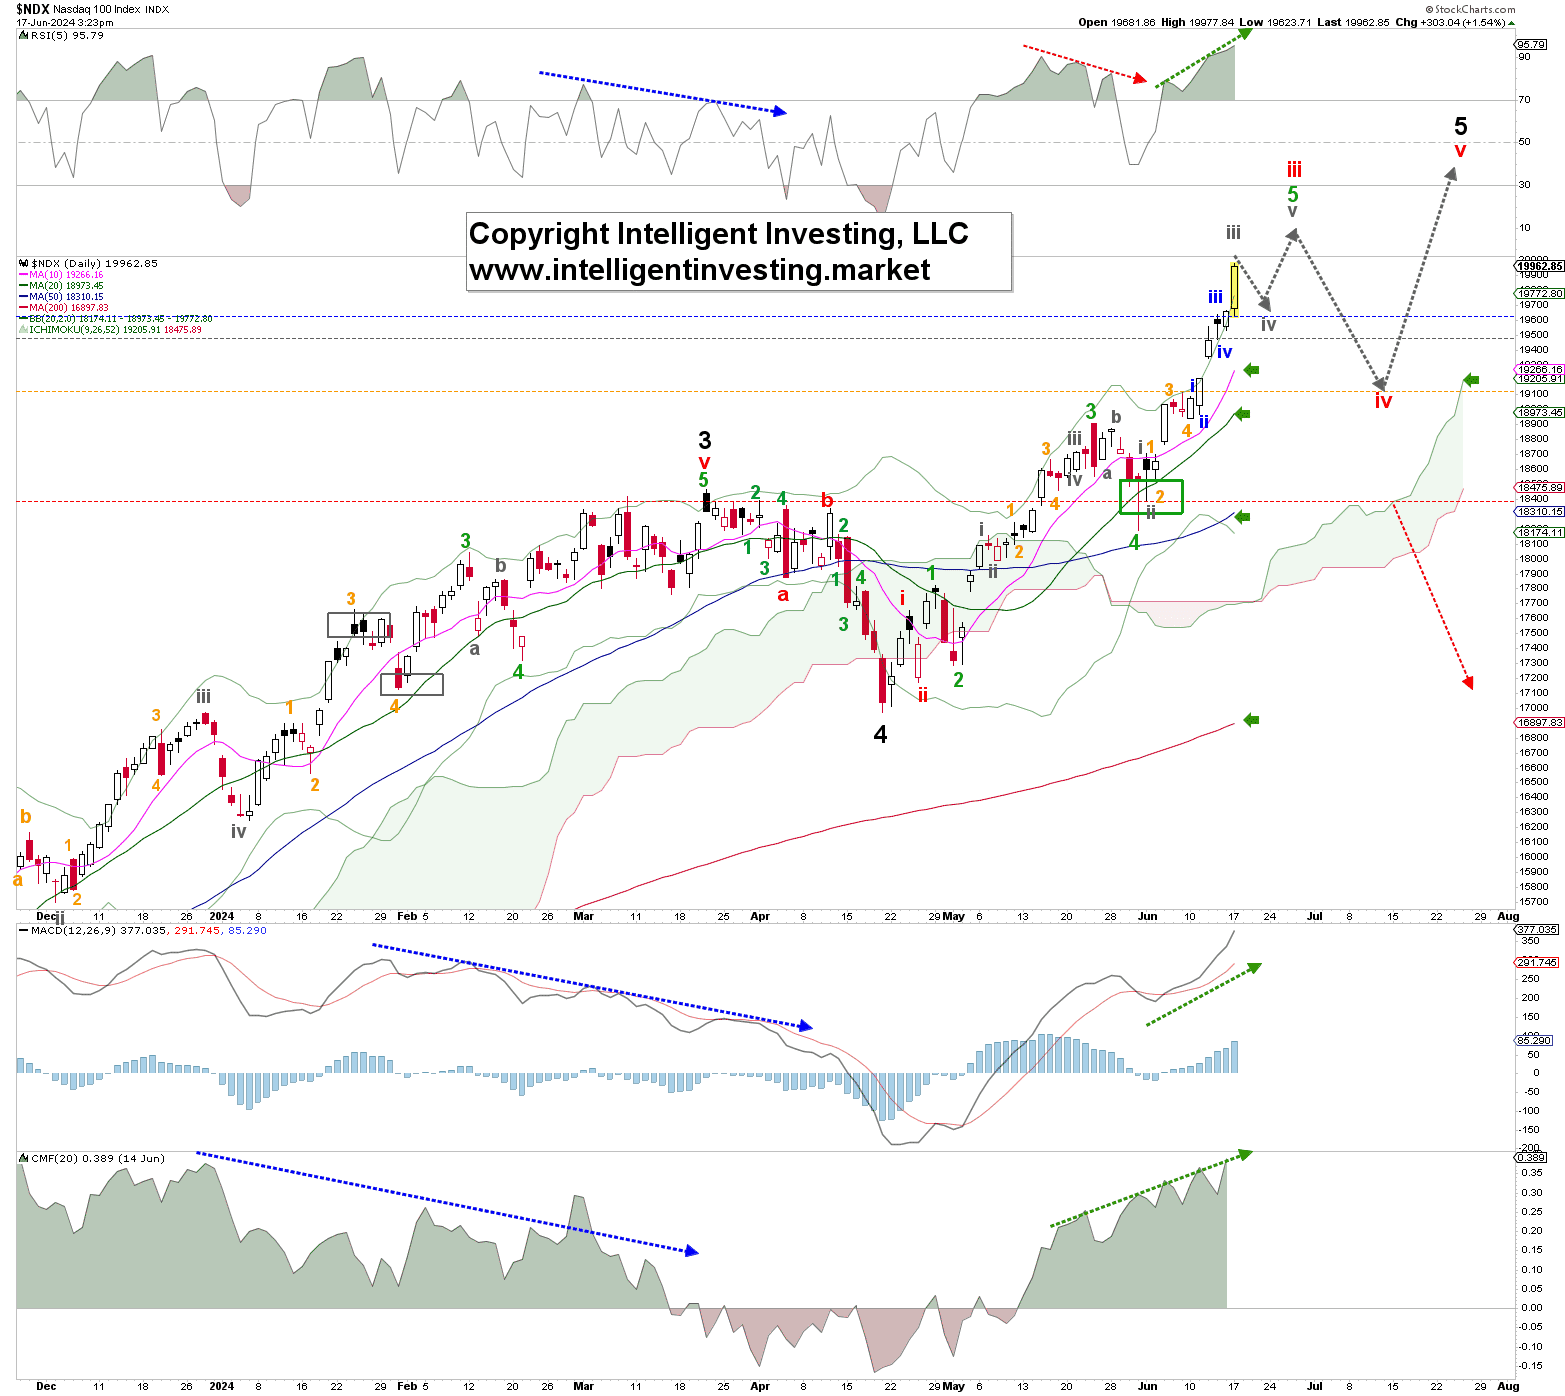
Namely, the index did top out a day after we posted our update at $18097. Right in the target zone, we had set forth. It bottomed out on May 31 at $18189 and closed that day at $18536. Also, right in the target zone for a potential (green) W-4, we had set forth. Thus, the bears could not close the index below the first warning level we had set at $18,400 (blue dotted horizontal line in the chart of our previous update). The NDX Bulls then took over and have run the ball almost up to $20,000 (!). Thus, the green W-3, 4, 5 vs W-a-b-c potentials we were tracking became the former. Poor bears. So, when is their next chance?

A Bullish Chart Requires a Bullish Outlook
Before we can answer that question, we must assess the current state of the market/chart using several objective parameters.
- All Technical Indicators (TIs: RSI5, MACD, CMF) are pointing up and are on a buy: Green dotted arrows.
- The TIs are overbought, but that is a condition of a strong market, and there are no negative divergences: compare with the red and blue dotted arrows.
- Price is above its rising Ichimoku cloud and above its rising daily Simple Moving Averages (d SMAs), which are Bullishly stacked: price>10>20>50>200d SMA: green horizontal arrows—a 100% Bullish chart.
- The warning levels for the Bulls (blue, grey, orange, and red) continue to rise. The first warning level (blue) is $19620, and the second (grey) is $19500, etc.: compare that to our previous update at $18465, 18200, etc., respectively.
Thus, we must apply a Bullish EWP count until proven otherwise, and as long as the index can stay above $19,100, the third warning level, we can foresee it wrapping up the grey W-iii, followed by a grey W-iv, v; red W-iv and -v. See the grey-dotted arrows/path.
The waves’ target zones are at this stage but subject to change: $20,100+/-50, $19,600+/-100, $21,000+/-500, $19,200+/-200, and $25,000, respectively. At this stage, only a break below $18,400, the red 4th warning level, will turn the chart from Bullish to Bearish, but we have the earlier warnings to tell us to become more cautious.