


Natural Gas Forecast Video for 23.06.23 by Bruce Powers
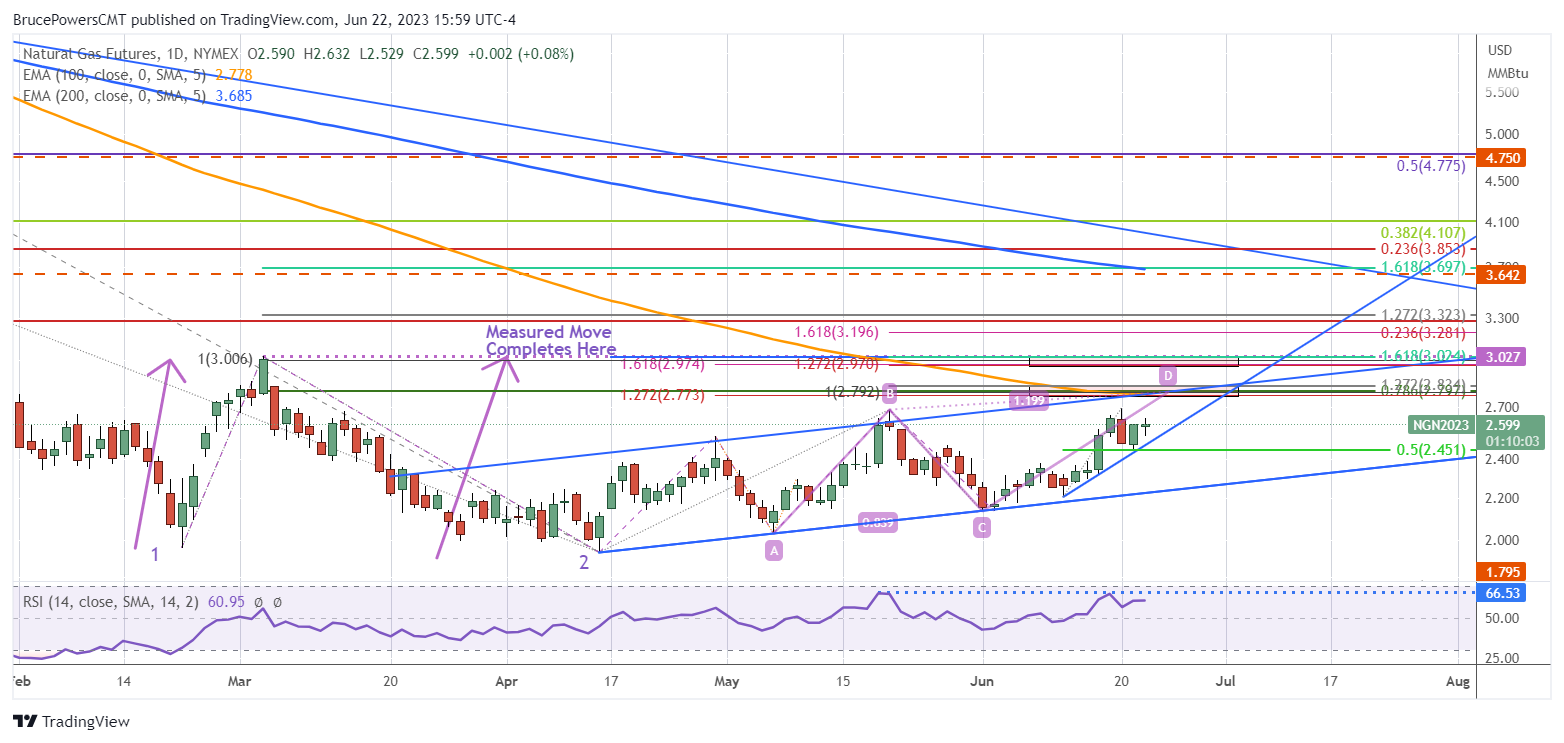
Natural gas traded in a relatively narrow range today yet did manage to exceed yesterday’s high and might close above it. A daily close above yesterday’s high of 2.60 would confirm strength and a continuation of the advance. If a confirmation occurs, then natural gas is more likely to exceed the trend high of 2.70 and keep going to reach the next key target zone. Nonetheless, today’s price action indicates that the retracement has likely competed, and the dominant uptrend can continue.

Recent Advances Reviewed
To date, the current advance has seen natural gas up as much as 26.2%. This is a shallower rally so far than the prior three, indicating it probably has more to go. Starting with the last rally, the prior advances were 32.2%, 30%, and 53.9%, respectively. At a target of 2.78, natural gas will be up 30% from its most recent swing low at 2.14 and match the minimum performance of the three previous rallies. That target is within the price zone highlighted in red, ranging from 2.77 to 2.83.
Watch the 100-Day EMA
The 100-Day EMA is also included within the next target zone and is currently at 2.78. If reached, it will be the first test of the line as resistance since natural gas fell below it in December of last year. The first test of a long-term moving average, such as the 100-Day or 200-Day, frequently sees price rejected at or near the line. Unless proven otherwise with a decisive daily close above the 100-Day EMA, the expectation is for resistance to be seen somewhere around the line.
Signs of Strength that Point to Higher Prices
A decisive daily close above the line opens the possibility for natural gas to keep the rally going into the next higher target zone from 2.97 to 3.02. However, the larger resistance zone around the 100-Day line also needs to be considered as it has a high of 2.83. So, a daily close above the line is bullish, but a stronger bullish signal is indicated on a daily close above 2.83.
For a look at all of today’s economic events, check out our economic calendar.


