



Dollar Index: Soft Jobs Data Dents Fed Case, but Yield Support Persists
September’s payrolls printed significantly below consensus. Nonfarm payrolls increased by 29,000, with the unemployment rate increasing to 4.2%. Traders quickly pared back expectations for another rate hike in October. However, despite the slower pace in labor market prints, U.S. yields remain elevated, increasing the appeal for the U.S. dollar. Higher U.S. yields and firming U.S. growth remain positive for the dollar despite the softer Fed outlook.

Euro: French Fiscal Strain Is More Relevant than Inflation
The euro’s largest issue is increasingly more fiscal than monetary. French government bonds sold off last week as investors questioned Paris’ ability to stabilize public finances ahead of the 2027 presidential election. The spread between French and German 10 year bonds briefly reached levels last seen during the eurozone’s sovereign debt crisis.
While the ECB was holding firm, euro-area inflation was running at 3.8%. Monday, ECB policymaker Joachim Nagel, said, “We are data dependent.” The recent rise in inflation expectations has dangled the prospect of further ECB tightening.
GBP: BoE Tightening Bets Clash with Difficult Budget
Cable has recently been rattled by a hawkish BoE and fears of rising UK fiscal spending. Officials at the BoE have said that they expect further energy cost inflation, which they expect will require more policy tightening. Market expectations are for a BoE hike in November. The UK economy surprised to the upside in the second quarter, growing at 0.5%. Although UK public finances overshot estimates, yield levels on longer-dated UK debt have remained high. The government has promised fiscal discipline in the October 28 budget, which adds a further layer of uncertainty and sensitivity to UK yields and the currency.
U.S. Dollar Index Technical Analysis: DXY Holds 101.76 as 102.49 Becomes the Next Upside Test
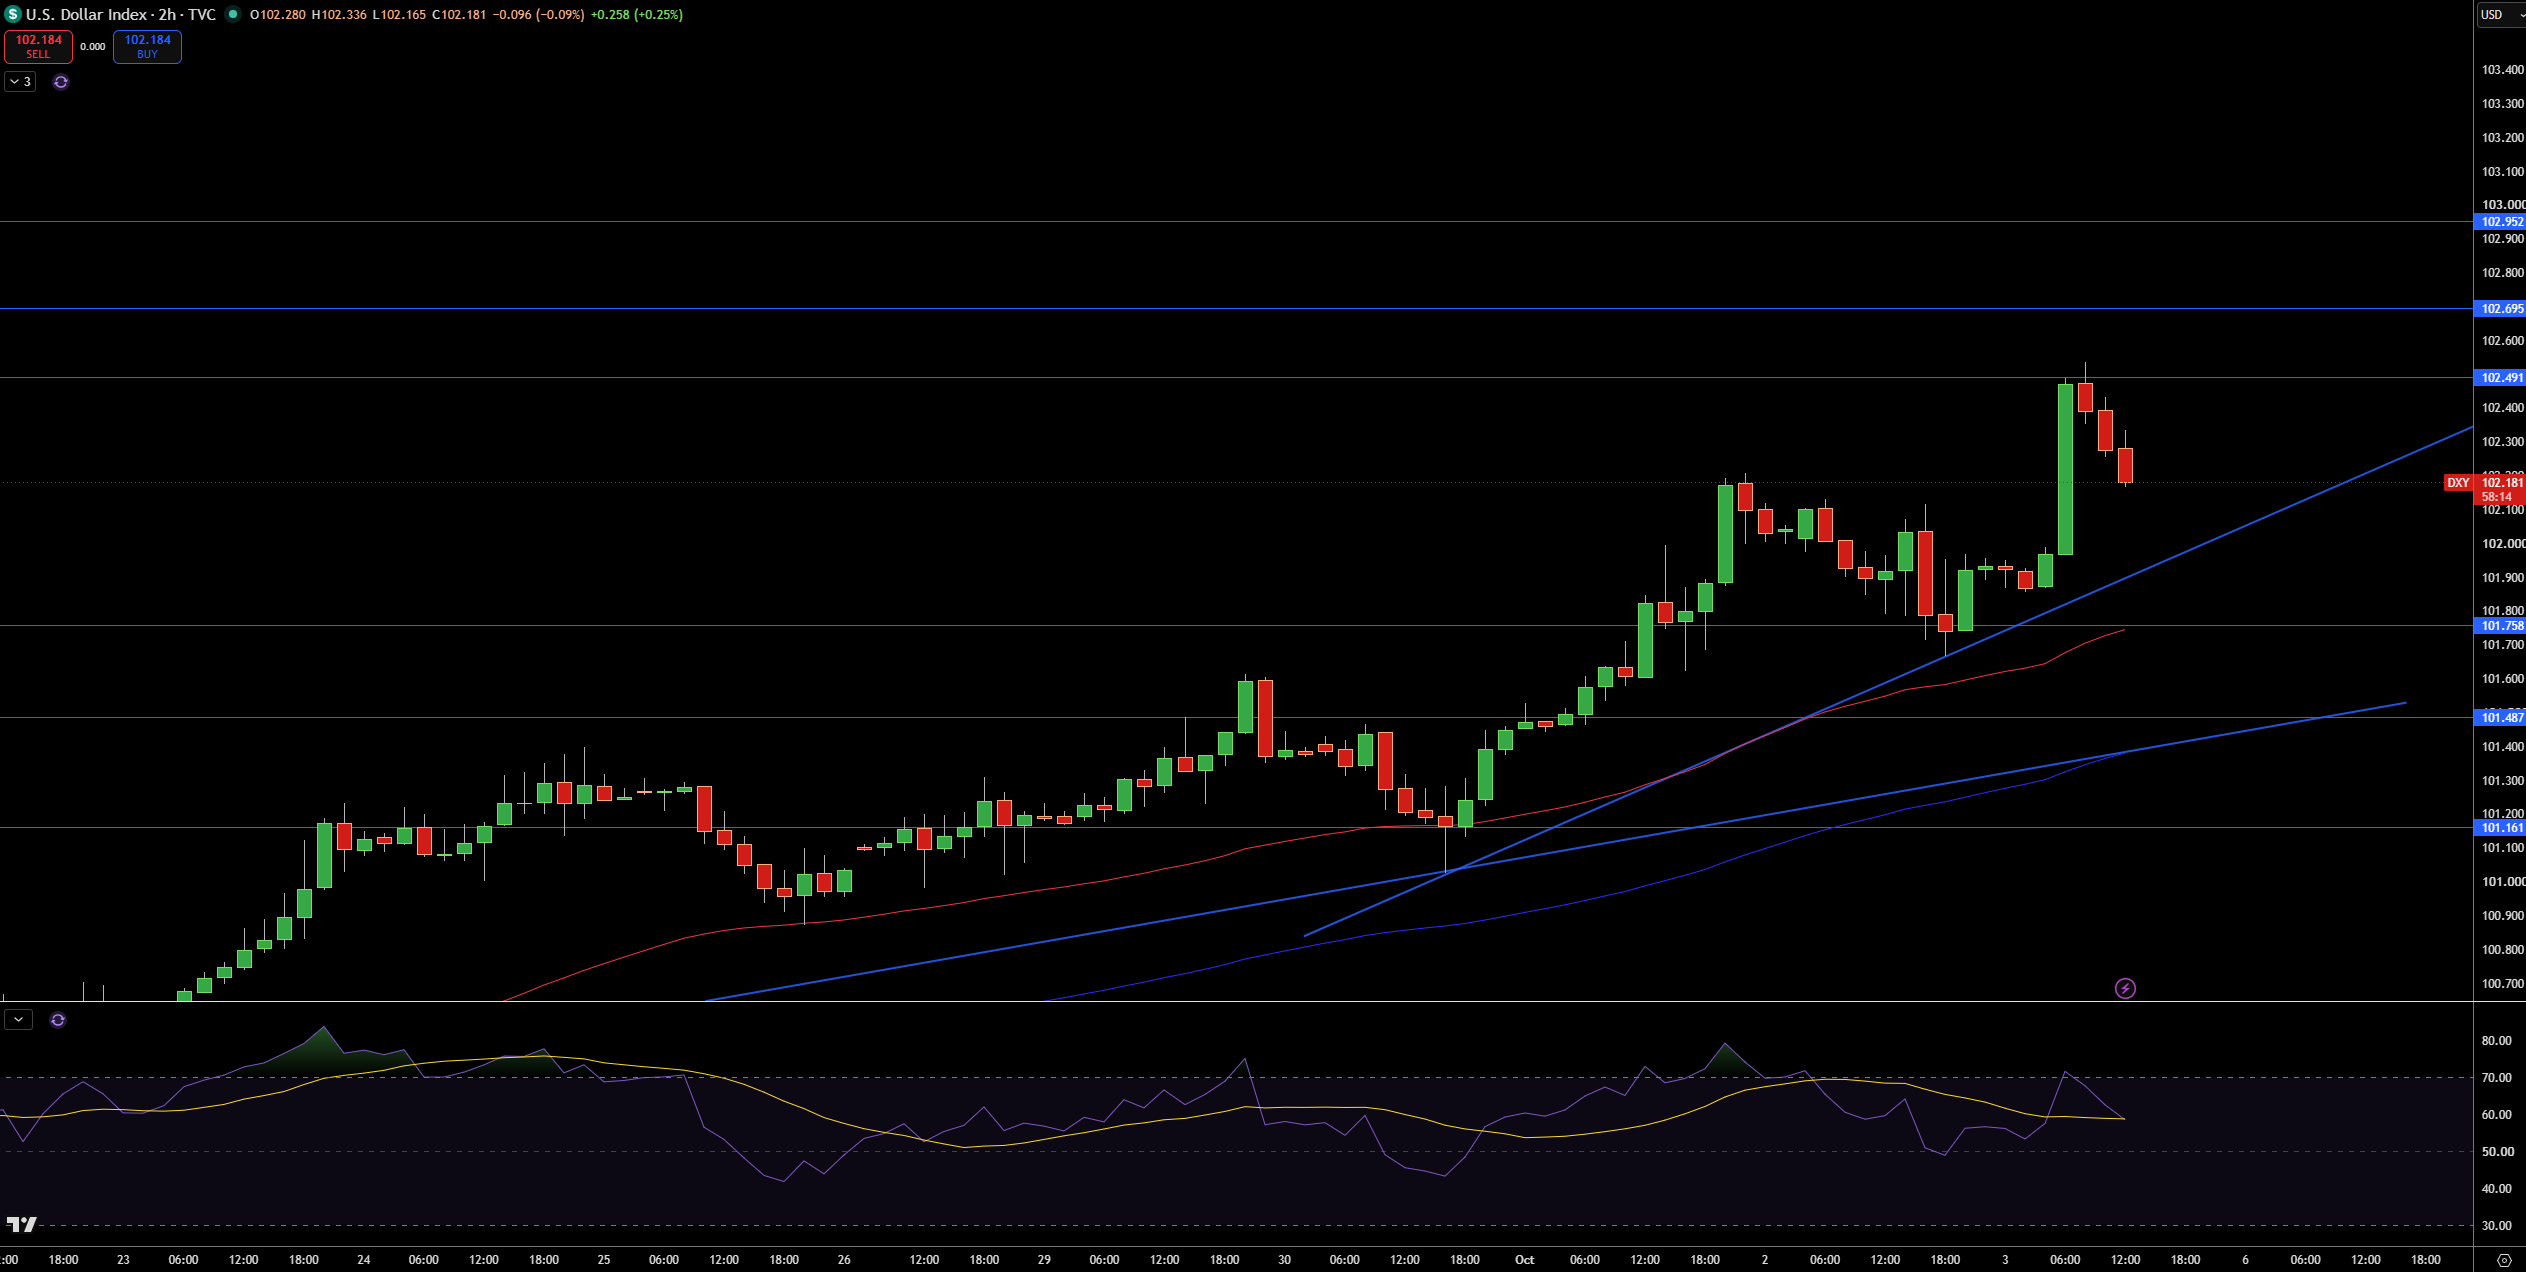
The DXY is currently trading at 102.18, with a lot of bullish interest near the rising trendline and 50-period moving average. While the pullback is deeper than the last few, it is still not deep enough to suggest that the structure is failing, and thus I view it as an opportunity for bulls to step in at current levels.
GBP/USD Price Forecast
Every new GBP/USD analysis as it publishes, today's technical signal and key levels, live price — on one page.
See all GBP/USD forecastsThe first notable resistance is at 102.49, with 102.70 and 102.95 coming in next. If we get a break of 101.76, 101.49 and 101.16 would be the next levels to watch.
Momentum is positive, and the Relative Strength Index (RSI) is in a positive territory suggesting that a brief period of consolidation would be considered normal. Overall, I am in agreement with the prevailing structure, and a break of the rising trendline, or the 101.49 region, would require a better explanation. Conversely, a move over the 102.49 region would open the door to 102.70, and possibly 102.95.
GBP/USD Technical Analysis: Sterling Holds $1.3180 Support as $1.3250 Caps the Recovery
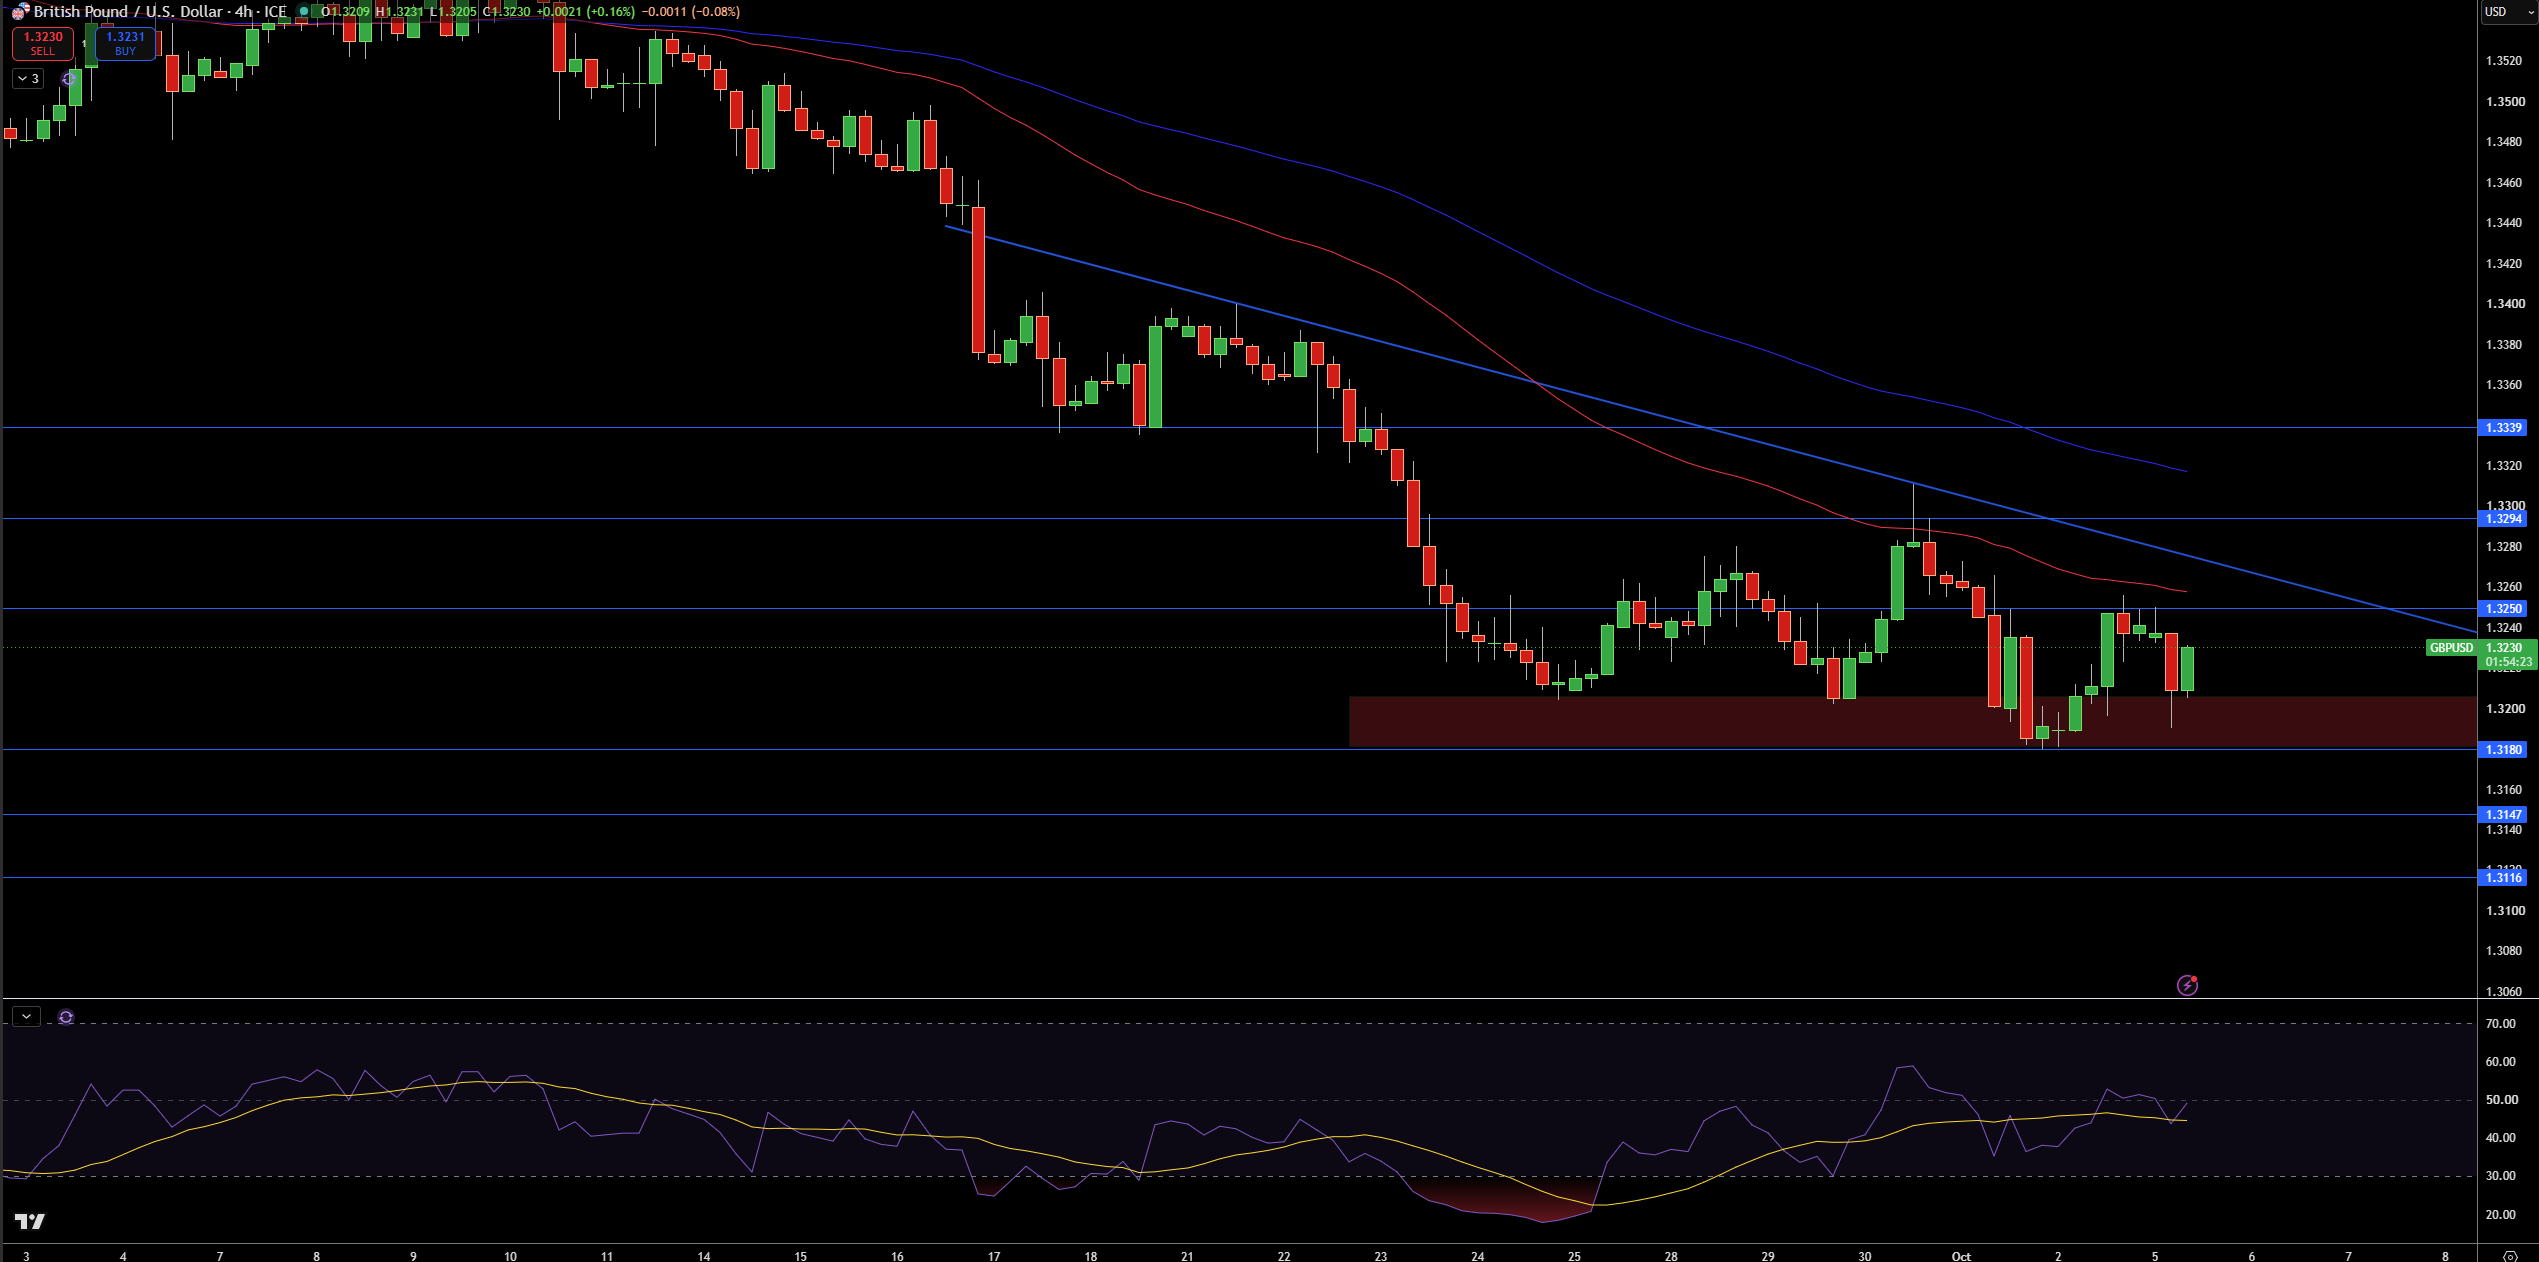
GBP/USD is trading around 1.3230 on the 4 hour chart, bouncing from the 1.3180 area. So far, I’ve seen bulls defend the 1.3180 area, but I’ve noticed that price continues to trade below both moving averages and a descending trendline. Because of this, I think the current move is a correction within the bigger picture.
There is potential resistance at 1.3250, and a break above this level would open 1.3294 and 1.3339. 1.3180 is the first key support level. Further declines would have 1.3147 and 1.3116 coming into play.
RSI continues to trade below 50, indicating bulls are still lacking momentum. I favor a bearish bias as long as GBP/USD is trading below 1.3250 and a descending trendline. A close above 1.3294 would be slightly bullish and a close below 1.3180 would be somewhat bearish.
EUR/USD Technical Analysis: Euro Breaks 1.1225 Support as 1.1090 Becomes the Next Downside Test
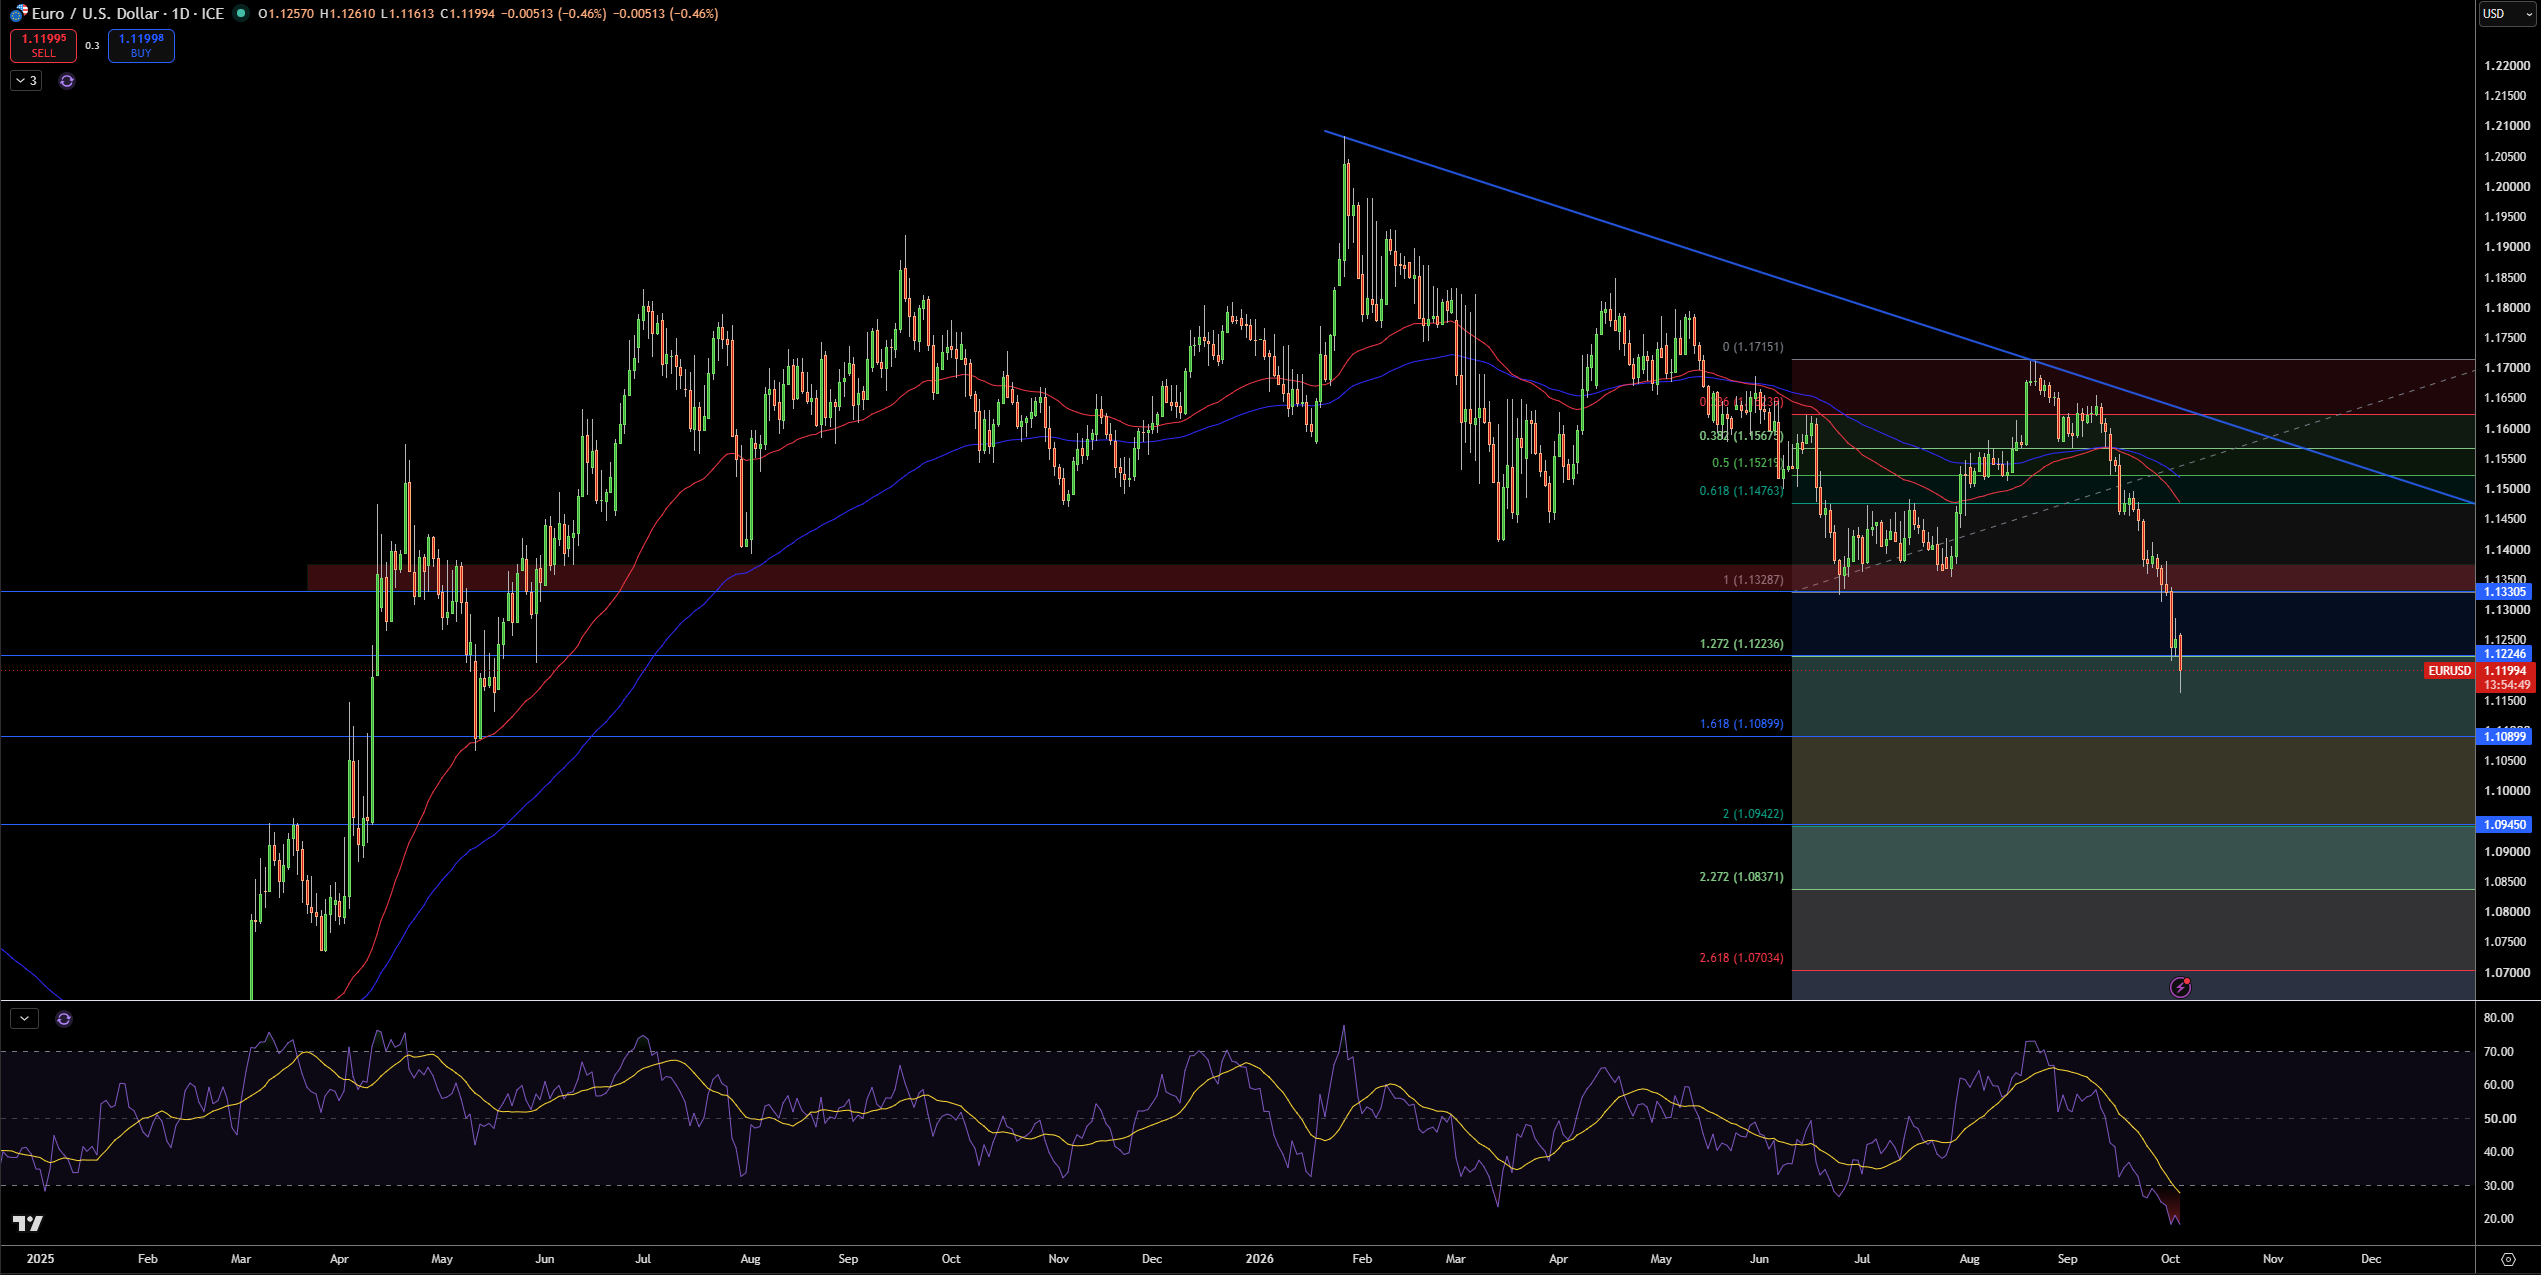
EUR/USD is trading at 1.1200 on the daily chart as price extends lower from 1.1225. While price is well below the moving averages and the descending trendline, and also trading below the recent lows, the larger bearish structure remains the same.
The next support comes in at 1.1090. If this level breaks, lower prices at 1.0945 can be expected. From a resistances standpoint, 1.1225 is the first level of interest, and if prices rise even higher, resistance comes in at 1.1331.
RSI has moved into oversold territory, indicating a potential bounce in price. Although, the bear trend remains in place as long as EUR/USD is trading below the 1.1225 level and the falling trendline. A break above 1.1331 would shift the focus to the bulls, and a break lower toward 1.1090 strengthens the bear case.



