Advertisement
Advertisement
Day Trading Stocks with Technical Analysis Rules: Trend lines
Updated: Jul 7, 2021, 17:54 GMT+00:00
We have already explained how to use support and resistance levels when day trading stocks and what is momentum trading in day trading. Today we will talk
We have already explained how to use support and resistance levels when day trading stocks and what is momentum trading in day trading. Today we will talk about trend lines and how we can find entry points for a trend-following strategy. It doesn’t matter if the stock is trading up or down during the day, since the same principles apply in either way. Identifying trend lines is an essential part of technical analysis and it’s difficult to find day trading strategies, that don’t make use of them.
Day trading rule: Identify the trend drawing a trend line
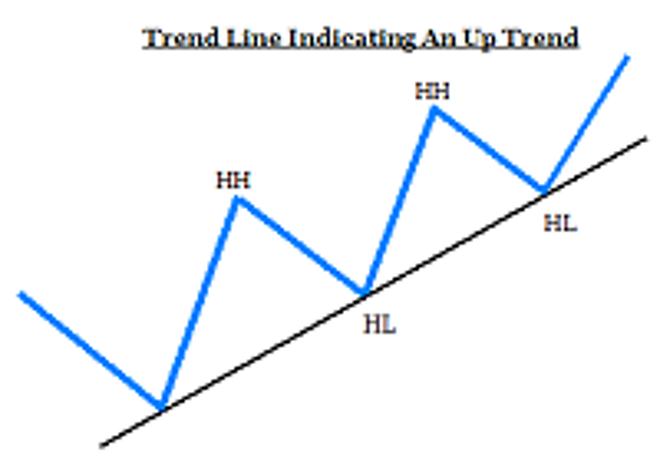
You have probably heard it: Trend is your friend. This is why we should always start analyzing stock graphs by identifying the trend. Drawing a trend line is simply connecting the lows during an uptrend or the highs of a down trend. Like any line in geometry, we need at least two points in order to draw a line. Let’s see the NOW 5-min stock chart.
I drew the trend line by connecting the two points indicated with red circles. Until then day traders couldn’t be sure of the trend’s direction, even with previous day’s data. The second higher low provided evidence that NOW stock would probably be heading north on 15th of November and a trend line could have been drawn at about 11:15.
Given the presence of a trend line, day trading NOW stock would have been relatively easy, by buying NOW shares, when the stock price pulled back to the trend line. These entry points are noted with green arrows. Also note the trend’s acceleration at 14:00 that would have been quite generous for anyone day trading this stock yesterday. However, buying at a much higher low like $30.50 due to the pullback would be considered a more risky investment, while the stock could have retraced back to $30 at that time. Also, the more times the trend line is confirmed, the more important the trend line is. Thus trading long at the last possible entry point would be regarded as the safest entry point of all.
On the other hand there isn’t usually that much time or volatility available when day trading stocks, in order for traders to draw trend lines. And even when volatile stocks do provide the necessary price fluctuations, we still need at least two lows or highs during the 7.5 hours window. Take a look at the 5-min WMC stock chart.
Online day trading the WMC uptrend would have been fruitless, since the entry point would have been 30 minutes before the closing bell. There was not so much time to take advantage of the uptrend. The only workaround in this stock chart would be if we connected the open’s price with the first low (first red circle) and entered long in the second circle. Yet, the significance of such a trend line wouldn’t have been the same and we might have been caught in a trend reversal.
As we discussed in the beginning, applying technical analysis with trend lines can be done even when stock prices are declining. Here is yesterday’s 5-min CRUS stock chart.
The declining trend line is drawn using the first two highs. In comparison with WMC chart, the two points are well defined and we are not really “creating” the trend line. Always listen to the market, don’t create scenarios that have a few clues of existence. The trend line was confirmed at around 11:15 when we could have shorted CRUS shares at $30. All 7 candlesticks that followed printed new lows, which means we could have exited on the next green candlestick without ever worrying about our position. The profit of the short sale would have been $1.50 per share in half an hour. The next entry point was at 13:45 (second red arrow), while the last one is very close to the day’s close.
Day trading for a living can be as simple as following simple day trading rules, like trend lines and support and resistance levels. A lot of day trading and charting software provide additional sophisticated tools to identify trends and predict price movements. Before you begin using those, I suggest you excel in basic elements of technical analysis such as trend lines.
About the Author
FX Empire editorial team consists of professional analysts with a combined experience of over 45 years in the financial markets, spanning various fields including the equity, forex, commodities, futures and cryptocurrencies markets.
Advertisement
