Advertisement
Advertisement
Using Retracements to Find Entry Point
Updated: Mar 5, 2019, 14:40 GMT+00:00
Intro
The term retracement represents an opportunity to enter a trade when a market reverts to a lower or higher price after it has experienced a gain or
The term retracement represents an opportunity to enter a trade when a market reverts to a lower or higher price after it has experienced a gain or decline. Using a number of different technical analysis tools a trader can define specific levels that represent prior support and resistances levels to take advantage of a retracement. Finding the appropriate retracement levels in conjunction with an underlying view of the future direction of a financial security may be helpful toward you overall success on a trade.
A Retracement after a Breakout
A technique in determining if a market is breaking out is to use the closing price to decide if enough investors believe the market is surging higher. This can be for intra-day prices or daily, weekly and monthly prices. There are many times when a price of a security moves above a trend line break out, but only retrace prior to the close which then forms resistance (or support).
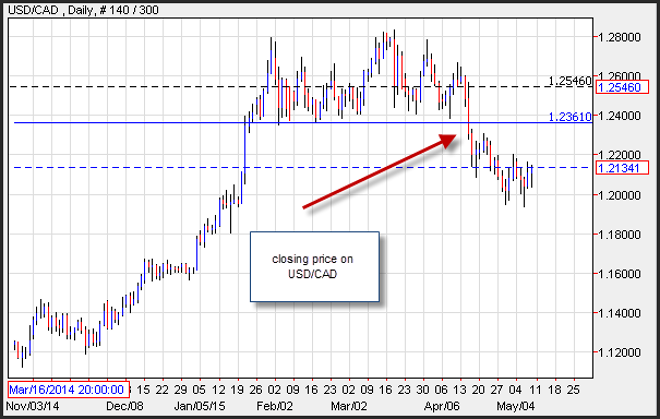
In the example chart of the daily USD/CAD below, you can see that once the closing price moved below the horizontal trend line support, prices continued to fall. But investors need to wait for the close to be sure the market would stay below the support level which is also considered the break out level.
So how do you use a retracement to enter given that you need to wait for the closing price? The ideal retracement is when the price reverts back toward former support which has now turned into resistance. On the very next day, prices attempted to climb back to the break down level, which represents the best place to sell the currency pair. Many times a trader will not get that type of opportunity until a few days later, but usually this represents a robust level to enter a trade and provides you with an exit level that might allow you to enjoy a winning trade.
Fibonacci Retracements
Another technique is to use mathematic retracement levels. These levels may be used to enter a trade or even targets with the aim to take profits on a trade. Fibonacci retracement levels are mathematic retracement levels that are formed from the Fibonacci sequence. Leonardo de Pisa or Fibonacci was a mathematician that discovered the Fibonacci sequence. In this sequence the sum of any two prior numbers equal the next. The ratios in those sequences form the base of the most popular retracements levels which are 38.2%, 50% and 61.8%.
A technique that may be used to measure the depth of a selloff (or rally). A Fibonacci retracement tool will help measure the distance of the decline (or increase) and then pinpoint the retracement levels. If a trader expects the market to go lower they may short the GBP/USD when it reaches a retracement level, and could use the next retracement level as a stop loss target. If, instead, they expect the exchange rate to move higher, then they may use a Fibonacci retracement target as an entry point once the price closes above it, and may then use any minor decline to enter the trade.
Risk warning: Forward Rate Agreements, Options and CFDs (OTC Trading) are leveraged products that carry a substantial risk of loss up to your invested capital and may not be suitable for everyone. Please ensure that you understand fully the risks involved and do not invest money you cannot afford to lose. Our group of companies through its subsidiaries is licensed by the Cyprus Securities & Exchange Commission (Easy Forex Trading Ltd- CySEC, License Number 079/07), which has been passported in the European Union through the MiFID Directive and in Australia by ASIC (Easy Markets Pty Ltd -AFS license No. 246566).
This article is a guest blog written by easy-forex
About the Author
Advertisement
